

National Portal Statistics
- The statistics are updated on monthly basis (Last update: 1st February, 2026).
- The Portal was launched on 23rd, May, 2007.
- Includes all transactions of the National Payments platform.
| Title | November 2025 | December 2025 | January 2026 |
|---|---|---|---|
| eServices Visits | 4,349,548 | 4,478,411 | 4,887,853 |
| Page Views | 7,904,462 | 8,098,432 | 8,427,642 |
| Number of Financial Transactions | 209,309 | 205,124 | 201,363 |
| Total Value of Financial Transactions (BD) | 67,379,799 | 64,767,577 | 62,602,393 |
| Number of pages viewed per visit | 6.3 | 6.3 | 6.3 |
| Average time spent per visit | 00:07:17 | 00:07:12 | 00:06:55 |
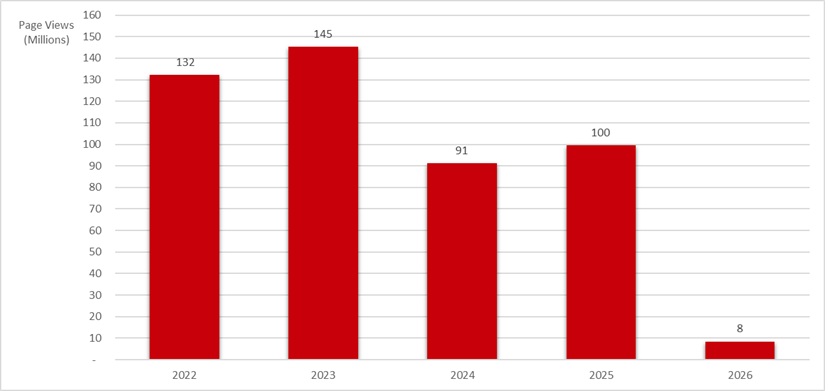
Annual Total Number of Page Views
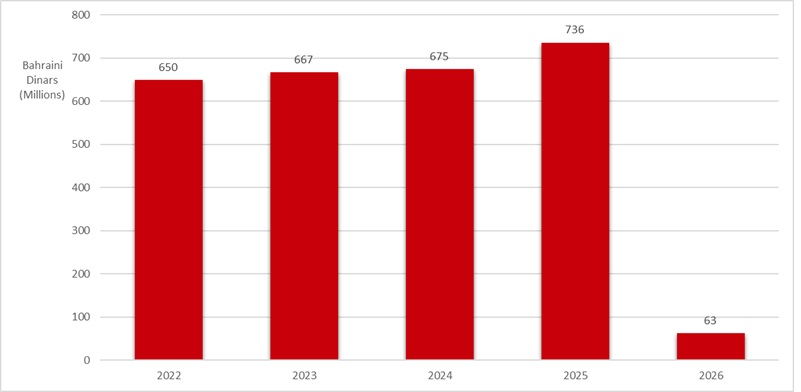
Annual Total Value of Financial Transactions
eServices
Use the provided eServices immediately, effortlessly, and around the clock Go to eServices Portal.
Government Services Catalogue
Find information about the offered government services across different channels Browse Services Catalogue.
Content Last Updated: 19 Mar, 2026


